Inquire
The market for older apartments / The 10% most expensive properties per m²
Do urban planning policies, whether proactive or reactive, help standardize property prices?
To try and answer this question, Notaires de France have monitored the prices of the 10% of most expensive properties over a 15-year period. Snapshots of these markets highlight a shift and concentration of the most expensive areas.
Over the last 15 years, the ratio of prices per m² of the most expensive 10% of properties to all properties has followed a similar trend in the biggest cities in France.
Two key periods stand out:
- standardization of market prices until 2006-2008, characterized by a steady fall in the ratio, which varies in scale according to the city. Nice shows the biggest fall in the ratio (2 in 2001 against 1.7 in 2008), whereas for Nantes, where the ratio was the lowest in 2001, the fall is less marked (-0.1 points);
- a bigger spread of market prices from 2007-2008, characterized by a constant rise in the ratio. In 2016, prices in Marseille, Toulouse and Nantes were as varied as in 2001 but more consistent than in Lyon and Nice.
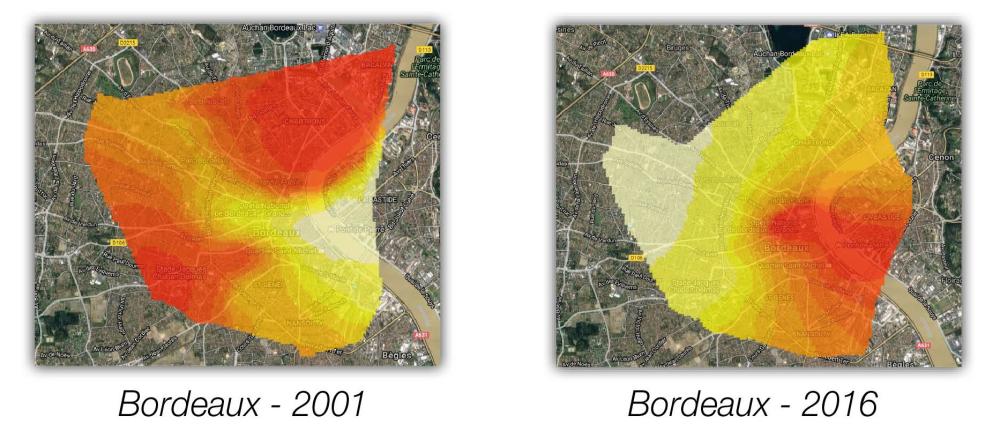
Price development in Bordeaux
In Bordeaux, premium properties in the city centre known as the Golden Triangle (cours de l’Intendance, allées de Tourny, cours Clémenceau) is much in demand and prices are constantly rising: in the region of €7,000 per square metre.
Properties in the historic quarter of old Bordeaux, the embankm (St Pierre, St Michel, grosse Cloche, Porte Cailhau...) are also much in demand; and prices keep rising.Along with Paris, Bordeaux is one of the provincial cities that best exem-plifies residents' keen interest in city centres: the North and East quartere which in 2000 had a concentration of the most expensive properties, are now being abandoned in favour of old Bordeaux.The development of the tram is a factor pushing up prices in and around the areas it serves.
Image (1000*yyy)
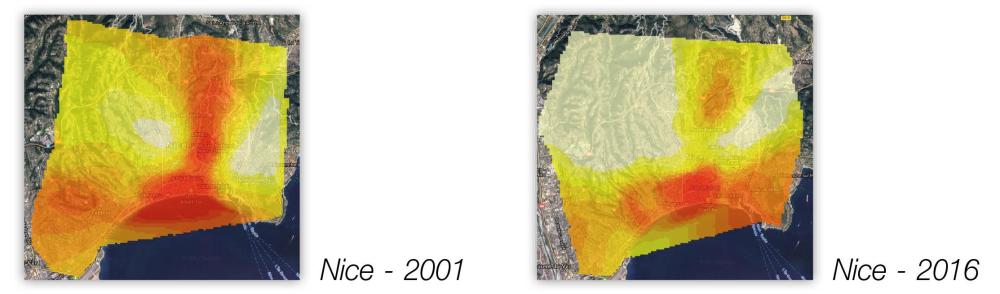
Price development in Nice
In Nice, over a period of 15 years, we see that the most expensive properties are concentrated along the coastal strip, henceforth on the section of the Promenade des Anglais between the Negresco and the Saleya market, the heart of the city centre and the harbour district, Mont Boron and Col de Villefranche.
The trend in the graph does not however necessarily reflect a fall (or rise) in prices in absolute value in the districts in question, but points to the districts where price rises (or falls) are observed in relative value, from one district to the next. If a property has maintained its value over the past 15 years, whereas has increased and exceeded that level in other districts, it is shown in a lighter shade in the graph.
Image (1000*yyy)
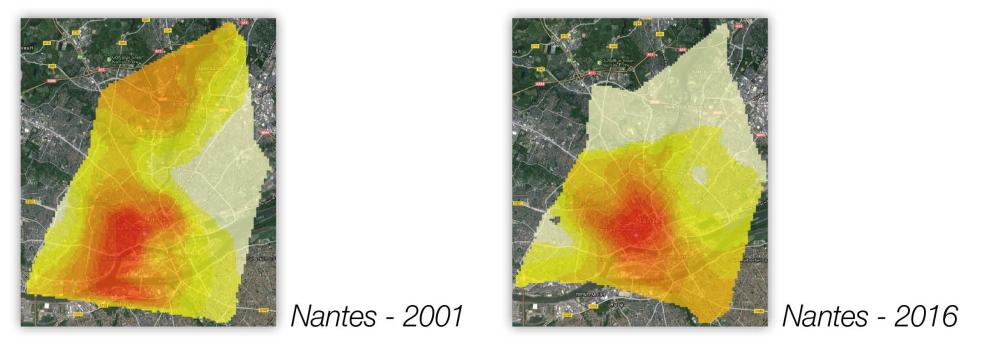
Price development in Nantes
In Nantes, we see a concentration of the most expensive areas, which were spread out a bit more consistently 15 years ago. The difference in median price between the most sought-after areas and the others has not however widened, and is even a little smaller than in 2001.
The île de Nantes quarter bears no resemblance whatsoever to what it was 15 years ago, so logically prices have adjusted accordingly.
Sud-Loire, with the exception of the Trentemoult sector, is more in evidence than in the past, and one can assume that it is benefiting from the Busway effect.
Finally, the city centre is still the most highly prized district, particularly in the heart of the centre, the Monselet/Procé quarter and the Saint-Félix/Hauts pavés quarter.
Image (1000*yyy)